Release Summary - Oct 2022
The following key features and improvements have been released in the Algonomy products during the month of October 2022.
Enterprise Dashboard
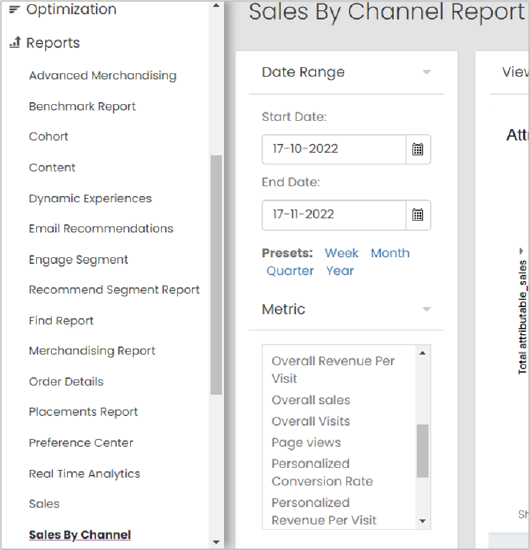
Update Sales and Sales by Channel Report Visualizations with Overall Visits and Personalized Visits
Sales and Sales by Channel reports are now added with new metrics called Overall Visits, Overall CTR, and Overall Conversion Rate. The visits that were captured prior to this enhancement are now renamed as personalized such as Visits to Personalized Visits, Rev Per Visit to Personalized Rev Per Visit and Overall Conversion Rate to Personalized Conversion Rate, as these visits include either a recommendation visit, recommendation click, or a purchase.
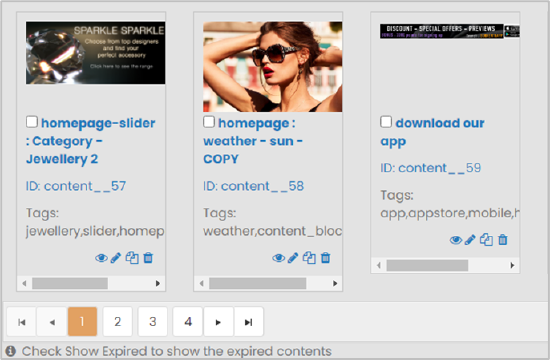
Content Catalog Supports Large Sized Content
Content Catalog has been updated with pagination to support large content size. The Content Catalog is available in two places for a user –content page and individual campaign.
Support for Custom Fonts for Email Campaigns
Customers can now have customized fonts for their email layouts and images. Customers can provide their branding fonts to be included made available as their customized fonts.
Data Engineering
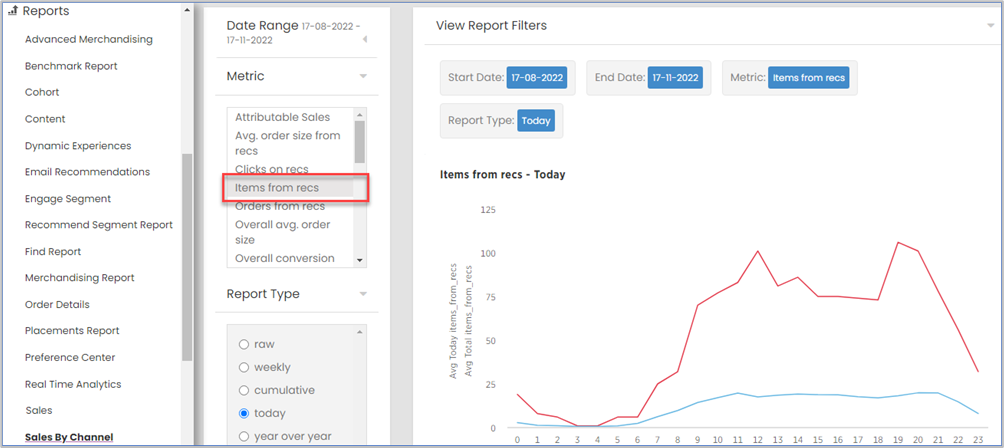
Added ‘Items from Recs’ Metric and ‘Report Type’ in Sales by Channel Report
Added a new metric ‘Items from Recs’ and ‘Report Type’ raw, weekly, cumulative, and so on in Sales by Channel report so that the users can decommission Sales Report.
Added visualizations for the below report types:
- raw
- Weekly
- cumulative
- today
- year over year
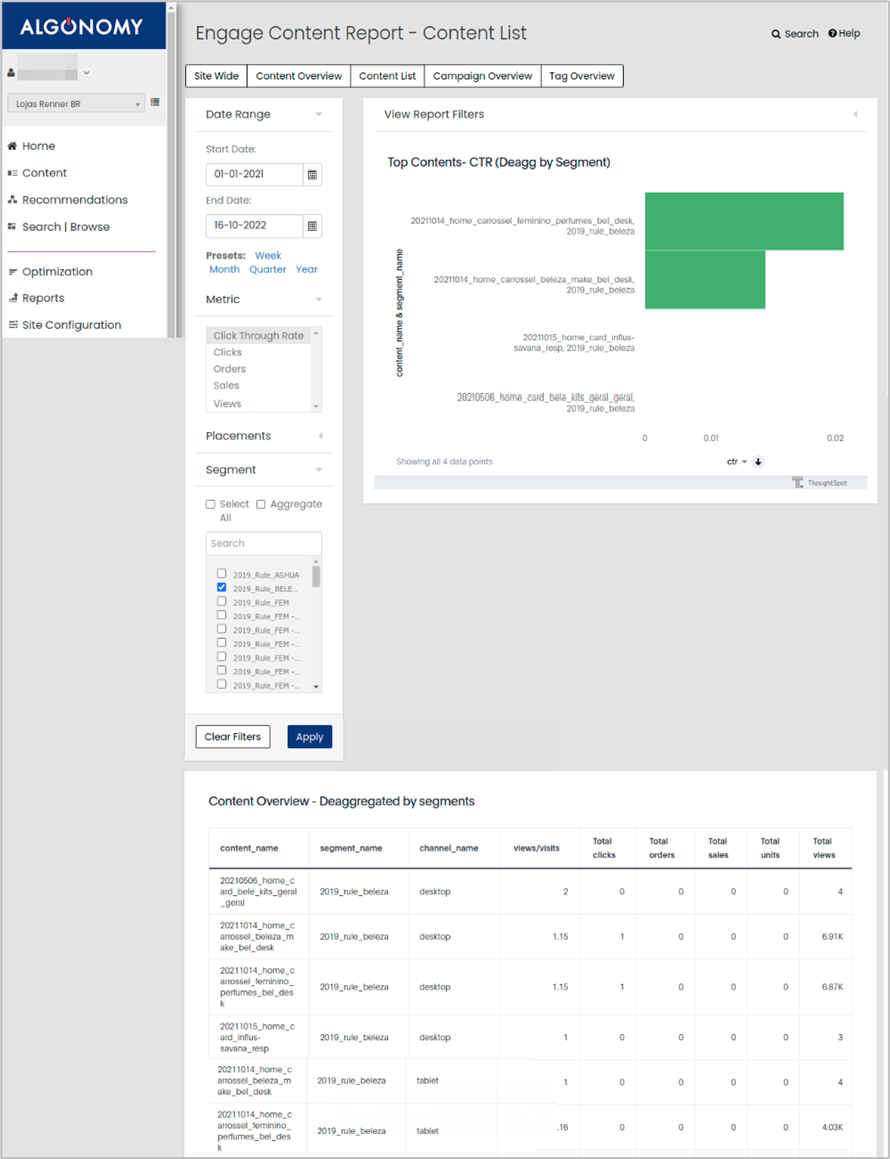
Introduced Filter Content List Report Based on Selected Segments
Marketers can now better understand how segments are performing with different content items to better understand what is working well for their segments. Segments as filters have been added to the Content List Report, when the user selects one or more segments, segments are de-aggregated in report on selection of multiple segments. The visualization now shows data as per the selection from the Segment filter.
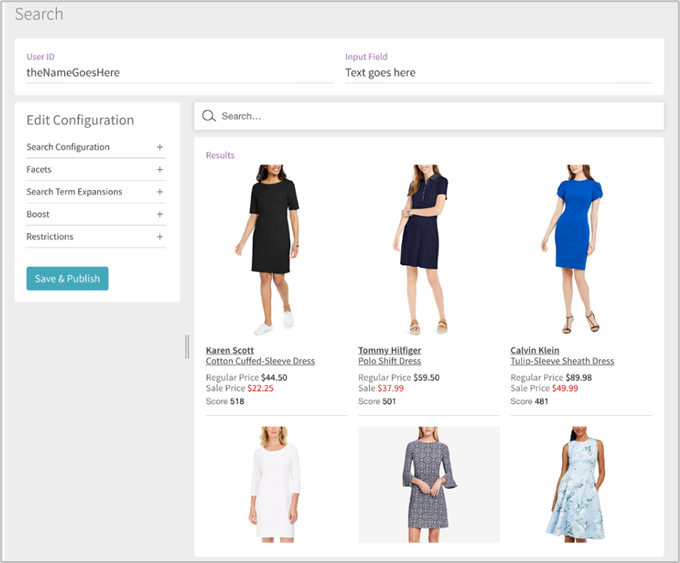
Find
Add Product Attributes to 'Boost Options'
To boost products with certain attributes, product attributes are added as boosting options and test the values that the user chooses to see how they perform before publishing. The attributes option should have a dropdown with attribute names and show if it is filterable or not.